|
文章目录
1、简介2、快速入门2.1 在线库快速入门2.2 本地库快速入门2.3 nodejs快速入门2.4 vue快速入门2.5 python快速入门
3、基本概念3.1 ol.map3.2 ol.view3.3 ol.layer3.4 ol.source3.5 ol.control3.6 ol.interaction
4、ol.source分析4.1 OpenStreetMap4.2 Thunderforest4.3 ArcGIS4.4 Bing4.5 Stamen4.6 高德地图4.7 天地图4.8 自定义
5、ol.control分析5.1 全屏5.2 比例尺5.3 鹰眼5.4 框选
6、其他6.1 加载本地瓦片数据6.2 加载geojson文件6.3 路径动画
结语
1、简介
官网地址: https://openlayers.org/ 源码地址: https://github.com/openlayers/openlayers

OpenLayers是一个高性能、功能丰富的库,用于在 Web 上创建交互式地图。它可以在任何网页上显示从任何来源加载的地图瓦片、矢量数据和标记。OpenLayers 的开发旨在进一步使用各种地理信息。它是完全免费的开源 JavaScript,在BSD 2-Clause License下发布。
OpenLayers is a high-performance, feature-packed library for creating interactive maps on the web. It can display map tiles, vector data and markers loaded from any source on any web page. OpenLayers has been developed to further the use of geographic information of all kinds. It is completely free, Open Source JavaScript, released under the BSD 2-Clause License.
OpenLayers 在所有支持HTML5和ECMAScript 5的现代浏览器上运行。这包括 Chrome、Firefox、Safari 和 Edge。对于较旧的浏览器和平台(Internet Explorer、Android 4.x、iOS v12 和更早版本、Safari v12 和更早版本),以下浏览器功能可能需要 polyfill。
支持平铺层:从OSM,Bing,MapBox,Stamen和您可以找到的任何其他XYZ源中拉出图块。还支持OGC映射服务和分层图层。 支持矢量层:渲染来自GeoJSON,TopoJSON,KML,GML,Mapbox矢量图块和其他格式的矢量数据。 
平铺层 从 OSM、Bing、MapBox、Stamen 和您可以找到的任何其他 XYZ 源中提取图块。还支持 OGC 映射服务和直到层。 矢量图层 渲染来自 GeoJSON、TopoJSON、KML、GML、Mapbox 矢量切片和其他格式的矢量数据。 尖端、快速和移动就绪 利用 Canvas 2D、WebGL 和 HTML5 的所有最新优势。开箱即用的移动支持。仅使用您需要的组件构建轻量级自定义配置文件。 易于定制和扩展 使用简单的 CSS 设置地图控件的样式。连接到不同级别的 API 或使用3rd 方库来自定义和扩展功能。

2、快速入门
github网页上显示当前OpenLayers库的最新版本是6.13.0。 
2.1 在线库快速入门
我们打开vscode,将如下代码复制进去,保存为一个新的.html文件(Untitled-1.html)。然后可以直接在浏览器里运行查看结果。
相关代码可以参考官网的代码: https://openlayers.org/en/latest/doc/quickstart.html
Untitled-1.html:
.map {
height: 45rem;
width: 100%;
}
OpenLayers example
爱看书的小沐的地图
var map = new ol.Map({
target: 'map',
layers: [
new ol.layer.Tile({
source: new ol.source.OSM()
})
],
view: new ol.View({
center: ol.proj.fromLonLat([104.1, 30.6]),
zoom: 10
})
});
  注意: 以下两行代码说明了上面的测试用例中使用的是在线访问的OpenLayers功能库文件(ol.css和ol.js)以及它的版本号。当然为了优化加载速度,我们也可以将它下载到本地或自己建设的服务器里,再引用,请查看下一小节《本地库快速入门》的说明。 注意: 以下两行代码说明了上面的测试用例中使用的是在线访问的OpenLayers功能库文件(ol.css和ol.js)以及它的版本号。当然为了优化加载速度,我们也可以将它下载到本地或自己建设的服务器里,再引用,请查看下一小节《本地库快速入门》的说明。
2.2 本地库快速入门
官网下载地址: https://openlayers.org/download/  将文件解压到本地,ol.css和ol.js在文件夹内。 将文件解压到本地,ol.css和ol.js在文件夹内。  新建一个文件Untitled-2.html: 新建一个文件Untitled-2.html:
Simple Map
#map {
height: 400px;
width: 100%;
}
let map = new ol.Map({
target: 'map',
layers: [
new ol.layer.Tile({
source: new ol.source.OSM()
})
],
view: new ol.View({
projection: 'EPSG:4326',
center: [104.1, 30.6],
zoom: 11
})
});

2.3 nodejs快速入门
官网地址: https://nodejs.org/en/
Node.js 是一个基于 Chrome V8 引擎的 JavaScript 运行时。 Node.js 是一个开源和跨平台的 JavaScript 运行时环境。 它几乎是任何类型项目的流行工具! Node.js 在浏览器之外运行 V8 JavaScript 引擎(Google Chrome 的内核)。 这使得 Node.js 的性能非常好。
下面我们开始安装nodejs开发环境。   新建一个测试文件夹,在里面下载nodejs环境里的OpenLayers库(node_modules)。 新建一个测试文件夹,在里面下载nodejs环境里的OpenLayers库(node_modules)。
cd C:\Users\tomcat
mkdir test
cd test
npm init
npm install ol
npm install --save-dev parcel-bundler
  openlayers库安装完之后的文件夹如下图所示: openlayers库安装完之后的文件夹如下图所示:   在测试主文件夹“C:\Users\tomcat\Desktop\test”里新建文件“index.js”: 在测试主文件夹“C:\Users\tomcat\Desktop\test”里新建文件“index.js”:
//index.js
import 'ol/ol.css';
import {Map ,View} from 'ol';
import TileLayer from 'ol/layer/Tile';
import OSM from 'ol/source/OSM';
const map = new Map({
target:'map',
layers:[
new TileLayer({
source:new OSM()
})
],
view:new View({
center:[0,0],
zoom:0
})
});
在测试主文件夹“C:\Users\tomcat\Desktop\test”里新建文件“index.html”:
DOCTYPE html>
Using Parcel with OpenLayers
#map{
width: 100%;
height: 250px;
}
 修改文件package.json的内容中script子项如下: 修改文件package.json的内容中script子项如下:
{
"name": "test",
"version": "1.0.0",
"description": "",
"main": "index.js",
"scripts": {
"test": "echo \"Error: no test specified\" && exit 1",
"start":"parcel index.html",
"build":"parcel build --public-url . index.html"
},
"author": "",
"license": "ISC",
"dependencies": {
"ol": "^6.13.0"
},
"devDependencies": {
"parcel-bundler": "^1.12.5"
}
}
或者
{
"name": "mapbox-vector-tiles-advanced",
"dependencies": {
"ol": "6.13.0"
},
"devDependencies": {
"parcel": "^2.0.0"
},
"scripts": {
"start": "parcel index.html",
"build": "parcel build --public-url . index.html"
}
}
执行如下命令进行打包操作,这样打包后可以将dist文件夹复制到服务器中。
npm run build
 
执行如下命令进行开启临时web服务器功能,浏览器通过网址可以访问网页内容操作。(按快捷键ctrl+c可停止运行应用)
npm start
 
2.4 vue快速入门
http://vuejs-templates.github.io/webpack/
To use this template, scaffold a project with vue-cli. It is recommended to use npm 3+ for a more efficient dependency tree.
$ npm install -g vue-cli
$ vue init webpack my-project
$ cd my-project
$ npm install
$ npm run dev
由于 npm 安装速度慢,本教程使用了淘宝的镜像及其命令 cnpm。
# 查看版本
$ npm -v
# 升级或安装 cnpm
npm install cnpm -g
或
npm install -g cnpm --registry=https://registry.npm.taobao.org
# 查看cnpm版本命令查看是否安装成功
cnpm -v
# 更换包管理器
npm config set registry https://registry.npm.taobao.org
# 检测cnpm是否成功替换npm
npm config get registry
Vue.js 提供一个官方命令行工具,可用于快速搭建大型单页应用。
# 全局安装 vue-cli
$ cnpm install --global vue-cli

# 创建用户测试文件夹
$ cd C:\Users\tomcat\Desktop
$ md test3
$ cd test3
# 创建一个基于 webpack 模板的新项目
$ vue init webpack my-project
# 这里需要进行一些配置,默认回车即可
 
$ cd my-project
$ cnpm install
$ cnpm run dev
 然后在浏览器中输入网址: 然后在浏览器中输入网址:
http://localhost:8080
 用VSCode打开刚刚创建的项目,打开文件夹my-project(或者直接拖拽文件夹到VsCode也可以) 用VSCode打开刚刚创建的项目,打开文件夹my-project(或者直接拖拽文件夹到VsCode也可以)  在左边的文件树上的components鼠标右键新建文件“MapView.vue”,它的代码如下: 在左边的文件树上的components鼠标右键新建文件“MapView.vue”,它的代码如下:
import "ol/ol.css";
import { Map, View } from "ol";
import TileLayer from "ol/layer/Tile";
import OSM from "ol/source/OSM";
import {fromLonLat} from 'ol/proj';
export default {
mounted() {
const map = new Map({
target: "mapDiv",
layers: [
new TileLayer({
source: new OSM(),
}),
],
view: new View({
center: fromLonLat([114.41, 32.82]),
zoom: 9,
}),
});
},
};
#mapDiv {
width: 100%;
height: 100%;
}
App.vue文件的代码如下:
import HelloWorld from './components/HelloWorld'
import MapView from './components/MapView'
export default {
name: 'App',
components: {
HelloWorld,
MapView
}
}
html,body{
padding: 0;
margin: 0;
width: 100%;
height: 100%;
}
#app {
font-family: 'Avenir', Helvetica, Arial, sans-serif;
-webkit-font-smoothing: antialiased;
-moz-osx-font-smoothing: grayscale;
text-align: center;
color: #2c3e50;
margin-top: 40px;
width: 100%;
height: 100%;
}
在VSCode的NPM Script窗口中,点击dev那一行后面的三角形按钮,编译运行项目,或者直接按下快捷键Ctrl+S也可以。  然后在浏览器中输入网址: 然后在浏览器中输入网址:
http://localhost:8081

2.5 python快速入门
pip install django==3.0.6 -i https://pypi.tuna.tsinghua.edu.cn/simple

django-admin

django-admin startproject HelloWorld

cd C:\Users\tomcat\HelloWorld
python manage.py runserver 0.0.0.0:5000
 在浏览器输入: 在浏览器输入:
http://127.0.0.1:5000/
 修改如下的文件的内容: 修改如下的文件的内容: 
urls.py:
from django.conf.urls import url
from . import views
urlpatterns = [
url(r'^$', views.sayHello),
url(r'^gethtml$', views.gethtml),
]
views.py:
from django.http import HttpResponse
from django.shortcuts import render
import datetime
def hello(request):
return HttpResponse("Hello world ! 2022")
def sayHello(request):
s = 'Hello World!'
current_time = datetime.datetime.now()
html = ' %s %s ' % (s, current_time)
return HttpResponse(html)
def gethtml(request):
return render(request, 'ol.html')
settings.py: 修改其中的TEMPLATES的子项DIRS的内容如下:
TEMPLATES = [
{
'BACKEND': 'django.template.backends.django.DjangoTemplates',
'DIRS': [os.path.join(BASE_DIR, 'templates')],
'APP_DIRS': True,
'OPTIONS': {
'context_processors': [
'django.template.context_processors.debug',
'django.template.context_processors.request',
'django.contrib.auth.context_processors.auth',
'django.contrib.messages.context_processors.messages',
],
},
},
]
放置自己编辑的的openlayers文件ol.html
新建文件夹templates,并在里面放置自己的openlayers网页文件ol.html。   ol.html: ol.html:
doctype html>
.map {
height: 45rem;
width: 100%;
}
OpenLayers example
爱看书的小沐的地图
var map = new ol.Map({
target: 'map',
layers: [
new ol.layer.Tile({
source: new ol.source.OSM()
})
],
view: new ol.View({
center: ol.proj.fromLonLat([104.1, 30.6]),
zoom: 10
})
});
在浏览器输入:
http://127.0.0.1:5000/

http://127.0.0.1:5000/gethtml
 
3、基本概念
在页面上放置地图,您将在下面找到一个完整的工作示例。创建一个新文件,复制下面的内容,然后在浏览器中打开:
.map {
height: 400px;
width: 100%;
}
OpenLayers example
My Map
var map = new ol.Map({
target: 'map',
layers: [
new ol.layer.Tile({
source: new ol.source.OSM()
})
],
view: new ol.View({
center: ol.proj.fromLonLat([37.41, 8.82]),
zoom: 4
})
});
或者 一个更简单代码片段脚本,用一个瓦片层渲染地图,如下所示:
import Map from 'ol/Map';
import View from 'ol/View';
import OSM from 'ol/source/OSM';
import TileLayer from 'ol/layer/Tile';
new Map({
layers: [
new TileLayer({source: new OSM()})
],
view: new View({
center: [0, 0],
zoom: 2
}),
target: 'map'
});
3.1 ol.map
OpenLayers 的核心组件是地图 ( ol/Map)。它被渲染到一个target容器(例如div网页上包含地图的元素)。所有地图属性都可以在构建时进行配置,也可以使用 setter 方法进行配置,例如setTarget().
下面的标记可用于创建div包含您的地图的标记。
#map {
height: 100%;
width: 100%;
position: absolute;
}
#map {
height: 400px;
width: 100%;
}
#map .ol-zoom-in, #map .ol-zoom-out {
background-color: white;
color: black;
}
#map .ol-zoom-extent button {
color: blue;
}
#map .ol-zoomslider {
background-color: gray;
}
#map .ol-zoomslider button{
background-color: black;
}
下面的脚本使用元素的 id 作为选择器来构造一个在div上面渲染的地图map。
import Map from 'ol/Map';
var map = new Map({target: 'map'});
3.2 ol.view
视图。它主要就是控制地图显示的位置以及层级等功能。地图不负责地图的中心、缩放级别和投影等事项。相反,这些是ol/View实例的属性。
import View from 'ol/View';
map.setView(new View({
center: [0, 0],
zoom: 2
}));
A View also has a projection. The projection determines the coordinate system of the center and the units for map resolution calculations. If not specified (like in the above snippet), the default projection is Spherical Mercator (EPSG:3857), with meters as map units.
The zoom option is a convenient way to specify the map resolution. The available zoom levels are determined by maxZoom (default: 28), zoomFactor (default: 2) and maxResolution (default is calculated in such a way that the projection’s validity extent fits in a 256x256 pixel tile). Starting at zoom level 0 with a resolution of maxResolution units per pixel, subsequent zoom levels are calculated by dividing the previous zoom level’s resolution by zoomFactor, until zoom level maxZoom is reached.
// 创建墨卡托投影坐标系
const projection = get("EPSG:3857");
const view = new View({
center: fromLonLat([105.14805, 35.26971]),
projection: projection,
zoom: 5,
maxZoom: 14,
minZoom: 4
});
const projection = get("EPSG:3857");
const view = new View({
// 设置成都为地图中心
center: [104.06, 30.67],
// 指定投影使用EPSG:4326一个等同于WGS84坐标系
projection: 'EPSG:4326', // 投影确定center用于地图分辨率计算的单位和单位的坐标系
zoom: 0,
});
view: new ol.View({
center: [13380880,3535823],// 设置地图中心坐标点
zoom: 8, // 设置初始化显示层级
minZoom: 7, // 最小显示层级
maxZoom: 14 // 最大显示层级
})
this.map.setView(new ol.View({
center: [114.064839,22.548857], //深圳
zoom: 15,
projection: 'EPSG:4326' //使用的坐标,这里是 WGS84 坐标系
}))
view: new ol.View({
center: ol.proj.transform([104, 30], 'EPSG:4326', 'EPSG:3857'),
zoom: 10
}),
默认 是Web Mercator的 EPSG:3857 坐标系(伪墨卡托投影,也被称为球体墨卡托),所以我们可以不写。但是我们用到的 center 数据值格式 是 EPSG:4326格式(常见的数据源),所以我们需要使用 fromLonLat() 方法把 EPSG:4326格式数据转换为 EPSG:3857 数据格式。 (1)EPSG:3857(投影):数据的可读性差和数值大存储比较占用内存。 (2)EPSG:4326(地理):使用此坐标系会导致页面变形。
let view = new View({
// projection: "EPSG:3857", //使用这个坐标系,默认为 3857,可以不写
center: fromLonLat([104.912777, 34.730746]), // 数据格式4326转为3857
zoom: 6.5 //缩放级别
});
3.3 ol.layer
图层。在openlayers中针对不同业务有着多种多样的图层类提供,而ol.layer相当于一个管理者,有效处理地图数据来源的多样性和复杂性问题。
图层是来自source. OpenLayers 有四种基本类型的层:
ol/layer/Tile- 渲染在按特定分辨率的缩放级别组织的网格中提供平铺图像的源。ol/layer/Image- 渲染以任意范围和分辨率提供地图图像的源。ol/layer/Vector- 在客户端渲染矢量数据。ol/layer/VectorTile- 渲染作为矢量图块提供的数据。
import TileLayer from 'ol/layer/Tile';
var osmLayer = new TileLayer({source: osmSource});
map.addLayer(osmLayer);
3.4 ol.source
数据源。它是整个地图背后的核心部分,如果没有数据,地图是渲染不出来。它与图层一一对应,针对不同的图层也会有不同的数据来源。
openlayers 默认使用的墨卡托投影坐标系,当然我们也是可以使用 WGS84 坐标系的。
为了获取层的远程数据,OpenLayers 使用ol/source/Source子类。这些可用于 OpenStreetMap 或 Bing 等免费和商业地图图块服务、WMS 或 WMTS 等 OGC 源,以及 GeoJSON 或 KML 等格式的矢量数据。
import OSM from 'ol/source/OSM';
var osmSource = OSM();
3.5 ol.control
控件。
3.6 ol.interaction
交互。
4、ol.source分析
4.1 OpenStreetMap
var map = new ol.Map({
target: 'map',
layers: [], // 创建图层容器,但不添加图层数据
view: new ol.View({
center: [0, 0],
//center: ol.proj.fromLonLat([37.41, 8.82]),
zoom: 2,
})
});
var tileLayer = new ol.layer.Tile({
source: new ol.source.OSM(),
}); // 创建图层数据
map.addLayer(tileLayer); // 图层添加至地图
或者
var map = new ol.Map({
target: 'map',
layers: [
new ol.layer.Tile({
source: new ol.source.OSM()
})
],
view: new ol.View({
center: [0, 0],
//center: [13380880,3535823],// 设置地图中心坐标点
zoom: 2,
maxZoom: 14,
minZoom: 0
}),
})
或者
// 使用内置的OSM
const tileLayer = new TileLayer({
source: new OSM()
})
map.addLayer(tileLayer );

4.2 Thunderforest
https://openlayers.org/en/latest/examples/xyz.html
https://tile.thunderforest.com/cycle/{z}/{x}/{y}.png?apikey=
const tileLayer = new ol.layer.Tile({
source: new ol.source.XYZ({
url: "https://{a-c}.tile.thunderforest.com/cycle/{z}/{x}/{y}.png?apikey=a5dd6a2f1c934394bce6b0fb077203eb",
attributions: "test"
})
});
map.addLayer(tileLayer);

4.3 ArcGIS
https://openlayers.org/en/latest/examples/vector-esri.html
const raster = new ol.layer.Tile({
source: new ol.source.XYZ({
attributions:
'Tiles © ArcGIS',
url:
'https://server.arcgisonline.com/ArcGIS/rest/services/' +
'World_Topo_Map/MapServer/tile/{z}/{y}/{x}',
}),
});
map.addLayer(raster);
const arcgisLayer = new ol.layer.Tile({
source: new ol.source.XYZ({
url: 'http://cache1.arcgisonline.cn/arcgis/rest/services/ChinaOnlineStreetPurplishBlue/MapServer/tile/{z}/{y}/{x}'
})
})

4.4 Bing
https://openlayers.org/en/latest/examples/bing-maps.html
const raster_bing = new ol.layer.Tile({
visible: true,
preload: Infinity,
source: new ol.source.BingMaps({
key: 'Your Bing Maps Key from https://www.bingmapsportal.com/ here',
imagerySet: 'RoadOnDemand',
// use maxZoom 19 to see stretched tiles instead of the BingMaps
// "no photos at this zoom level" tiles
// maxZoom: 19
}),
})
map.addLayer(raster_bing);

4.5 Stamen

// https://stamen.com/
const map = new Map({
layers: [
new TileLayer({
source: new Stamen({
layer: 'watercolor',
}),
}),
new TileLayer({
source: new Stamen({
layer: 'terrain-labels',
}),
}),
],
target: 'map',
view: new View({
center: fromLonLat([-122.416667, 37.783333]),
zoom: 12,
}),
});

4.6 高德地图
const tileLayer = new ol.layer.Tile({
source: new ol.source.XYZ({
url: 'https://webrd01.is.autonavi.com/appmaptile?lang=zh_cn&size=1&scale=1&style=8&x={x}&y={y}&z={z}'
})
})
map.addLayer(tileLayer);

4.7 天地图
TiandituKey = "***********************";
var cityPos = ol.proj.fromLonLat([116.28, 39.54]);
//实例化Map对象加载地图,默认底图加载天地图
var map = new ol.Map({
layers: [
new ol.layer.Tile({
title: "天地图矢量图层",
source: new ol.source.XYZ({
url: "http://t0.tianditu.com/DataServer?T=vec_w&x={x}&y={y}&l={z}&tk=" + TiandituKey,//parent.TiandituKey()为天地图密钥
wrapX: false
})
}),
new ol.layer.Tile({
title: "天地图矢量注记图层",
source: new ol.source.XYZ({
url: "http://t0.tianditu.com/DataServer?T=cva_w&x={x}&y={y}&l={z}&tk=" + TiandituKey,//parent.TiandituKey()为天地图密钥
wrapX: false
})
})
],
//地图容器div的ID
target: 'mapCon',
view: new ol.View({
//地图初始中心点
center: cityPos,
minZoom: 1,
zoom: 6
})
});
4.8 自定义
// 创建基础矢量图层
const baseLayer = new TileLayer({
source: new TileWMS({
url: 'http://127.0.0.1:8080/services/Map/MapService/WMS',
params: {LAYERS: 'Map', CRS: projection},
projection: projection
})
});
const map = new Map({
layers: [baseLayer],
target: "sceneControlDiv",
view: view,
overlays: [popup],
controls: []
});
5、ol.control分析
5.1 全屏
var fullScreen = new ol.control.FullScreen();
let map = new ol.Map({
target: 'map',
layers: [
new ol.layer.Tile({
source: new ol.source.OSM()
})
],
view: new ol.View({
projection: 'EPSG:4326',
center: [104.1, 30.6],
zoom: 11
}),
controls: ol.control.defaults().extend([fullScreen]),
});
主要是通过上面的两行代码实现全屏功能: var fullScreen = new ol.control.FullScreen(); controls: ol.control.defaults().extend([fullScreen]), 
5.2 比例尺
let map = new ol.Map({
target: 'map',
layers: [
new ol.layer.Tile({
source: new ol.source.OSM()
})
],
view: new ol.View({
projection: 'EPSG:4326',
center: [104.1, 30.6],
zoom: 11
}),
controls: ol.control.defaults().extend([
new ol.control.FullScreen(),
new ol.control.MousePosition(),
new ol.control.OverviewMap(),
new ol.control.ScaleLine(),
new ol.control.ZoomSlider(),
new ol.control.ZoomToExtent()
]),
});

5.3 鹰眼
// 创建鹰眼控件
let overviewMapControl = new ol.control.OverviewMap({
layers: [
new ol.layer.Tile({
source: new ol.source.OSM()
})
]
});
let map = new ol.Map({
target: 'map',
layers: [...],
view: ...,
controls: ol.control.defaults().extend([
// 添加鹰眼控件
overviewMapControl
])
});

5.4 框选
Title
body, html {
width: 100%;
height: 100%;
}
#map, #info {
width: 100%;
height: 80%;
}
左上角:
经度:纬度:
右下角:
经度:纬度:
开始框选
var style = new ol.style.Style({
fill: new ol.style.Fill({
color: 'rgba(96,96,96, 0.3)'
}),
stroke: new ol.style.Stroke({
color: 'rgba(96,96,96, 0.3)',
width: 2
}),
image: new ol.style.Circle({
radius: 5,
stroke: new ol.style.Stroke({
color: 'rgba(96,96,96, 0.3)'
}),
fill: new ol.style.Fill({
color: 'rgba(96,96,96, 0.3)'
})
})
});
map = new ol.Map({
target: 'map',
layers: [
new ol.layer.Tile({
source: new ol.source.OSM()
})
],
view: new ol.View({
center: ol.proj.transform([104.1, 30.6], 'EPSG:4326', 'EPSG:3857'),
zoom: 9
})
});
var layer = new ol.layer.Vector({
source: new ol.source.Vector(),
style: style
});
var draw = new ol.interaction.Draw({
source: layer.getSource(),
type: 'Circle',
style: style,
geometryFunction: ol.interaction.Draw.createBox()
});
function clickHandler(e1) {
$('#map').bind("click", function (e) {
var pointermove = $('#map').bind("pointermove", function (e2) {
var coordinate = ol.proj.transform(map.getEventCoordinate(e2), 'EPSG:3857', 'EPSG:4326');
$("#lon2").attr("value", coordinate[0].toFixed(6));
$("#lat2").attr("value", coordinate[1].toFixed(6));
}).bind("click", function () {
$("#map").off('pointermove');
$("#map").off('click');
});
if ($("#lon1").val() == "" && $("#lat1").val() == "") {
var coordinate = ol.proj.transform(map.getEventCoordinate(e), 'EPSG:3857', 'EPSG:4326');
$("#lon1").attr("value", coordinate[0].toFixed(6));
$("#lat1").attr("value", coordinate[1].toFixed(6));
}
});
if ("取消框选" == ($("#btnclick").text())) {
$("#btnclick").text("开始框选");
$("input").attr("value", "");
layer.getSource().clear();
map.removeLayer(layer);
} else {
$("#btnclick").text("取消框选");
map.addInteraction(draw);
}
}
draw.on('drawend', function () {
map.addLayer(layer);
map.removeInteraction(draw);
});

6、其他
6.1 加载本地瓦片数据
本地瓦片数据测试
#map {
width: 100%;
height: 400px;
}
#myposition,
#myproj {
float: left;
position: relative;
bottom: 0px;
width: 400px;
height: 10px;
z-index: 1000;
}
.mousePosition {
color: red;
font-size: 20px;
}
Projection
EPSG:4326
EPSG:3857
Precision
// 选取投影的控件
var projectionSelect = document.getElementById("projection");
projectionSelect.addEventListener('change', function (event) {
// 使mousePositionControl控件的投影与选取投影控件选取的投影一致
mousePositionControl.setProjection(event.target.value);
});
var precisionInput = document.getElementById('precision');
precisionInput.addEventListener('change', function (event) {
// 设置mousePositionControl控件的坐标格式
var format = ol.coordinate.createStringXY(event.target.valueAsNumber);
mousePositionControl.setCoordinateFormat(format);
});
//定义坐标系
let projParam = 'EPSG:4326' //EPSG:3857
//定义鼠标位置控件对象
var mousePositionControl = new ol.control.MousePosition({
className: 'mousePosition',
coordinateFormat: ol.coordinate.createStringXY(6),
projection: 'EPSG:4326',
target: document.getElementById('myposition'),
undefinedHTML: ';'
});
//标准TMS切片加载方式
var offlineSource = new ol.source.XYZ({
tileUrlFunction: function (coordinate) {
console.log(coordinate[0], coordinate[1], coordinate[2]);
var z = coordinate[0];
var x = coordinate[1];
var y = Math.pow(2, z - 1) + coordinate[2];
return "file:///D:/maps/" + z + "/" + x + "/" + y + ".png";
},
maxZoom: 19,
minZoom: 0,
projection: projParam
});
//定义图层:地图
var offlineMapLayer = new ol.layer.Tile({
source: offlineSource
});
//定义图层:瓦片网格线
var tileGridLayer = new ol.layer.Tile({
source: new ol.source.TileDebug({
projection: projParam,
tileGrid: offlineSource.getTileGrid(),
})
});
//定义地图对象
var map = new ol.Map({
view: new ol.View({
center: [104.1, 30.6],
projection: projParam,
zoom: 7
}),
controls: ol.control.defaults().extend([mousePositionControl]),
target: 'map',
layers: [],
});
//将两个图层添加到地图对象里
map.addLayer(offlineMapLayer);
map.addLayer(tileGridLayer);
本地瓦片数据:  浏览器显示加载: 浏览器显示加载: 
6.2 加载geojson文件
nodejs搭建服务器,加载如下网页。
.map {
height: 45rem;
width: 100%;
}
OpenLayers example
爱看书的小沐的地图
var pointGeoJsonLayer = new ol.layer.Vector({
title: 'points',
source: new ol.source.Vector({
projection: 'EPSG:4326',
url: 'http://localhost:9000/china.json',
format: new ol.format.GeoJSON()
})
});
var map = new ol.Map({
target: 'map',
layers: [
new ol.layer.Tile({
source: new ol.source.OSM()
}),
pointGeoJsonLayer
],
view: new ol.View({
center: ol.proj.fromLonLat([104.1, 21.6]),
zoom: 3
})
});
 china.json: china.json: 
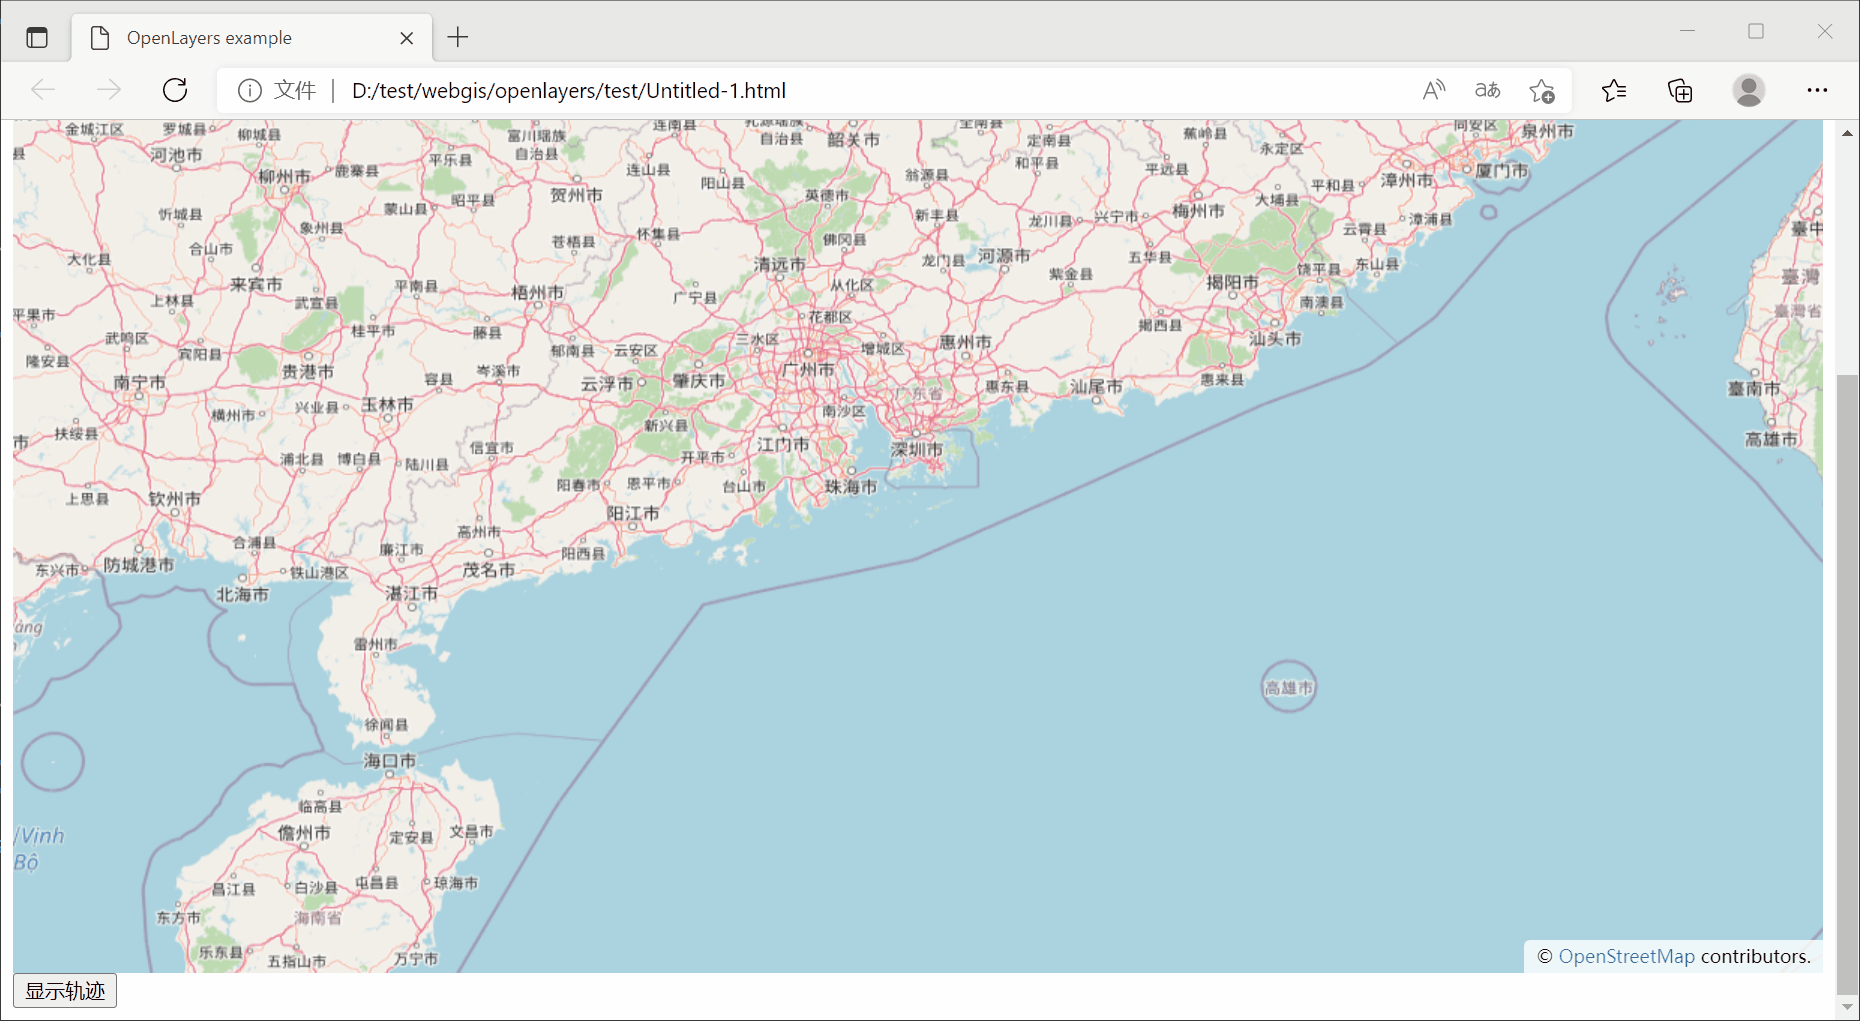
6.3 路径动画
.map {
height: 45rem;
width: 100%;
}
OpenLayers example
爱看书的小沐的地图
显示轨迹
//生成随机轨迹点
var points = [
[114.1, 22.6]
];
var x = 114.1;
var y = 22.6;
for (i = 0; i
return new ol.style.Style({
text: new ol.style.Text({
//位置
textAlign: 'center',
//基准线
textBaseline: 'middle',
//文字样式
font: 'normal 14px arial',
//文本内容
text: feature.get('name'),
//文本填充样式(即文字颜色)
fill: new ol.style.Fill({
color: '#000000'
}),
stroke: new ol.style.Stroke({
color: '#ffcc33',
width: 12
})
})
});
}
var iconFeature = new ol.Feature({
});
iconFeature.setStyle(createLabelStyle(iconFeature));
//矢量标注的数据源
var vectorSource = new ol.source.Vector({
features: [iconFeature]
});
//矢量标注图层
var textLayer = new ol.layer.Vector({
source: vectorSource
});
//map.addLayer(textLayer);
// 创建瓦片图层
var tileLayer = new ol.layer.Tile({
source: new ol.source.OSM()
});
// 创建轨迹点图层
var markerLayer = new ol.layer.Vector({
source: new ol.source.Vector(),
style: new ol.style.Style({
image: new ol.style.Circle({
radius: 10,
fill: new ol.style.Fill({
color: 'red'
})
})
})
});
// 创建轨迹线图层
var lineLayer = new ol.layer.Vector({
source: new ol.source.Vector(),
style: new ol.style.Style({
stroke: new ol.style.Stroke({
width: 3,
color: 'blue'
})
})
});
var map = new ol.Map({
target: 'map',
layers: [
tileLayer,
lineLayer,
markerLayer,
textLayer
],
view: new ol.View({
center: [114.064839, 22.548857],
zoom: 8,
projection: 'EPSG:4326'
})
});
var timer1;
var index = 0;
$('#btnStart').click(function () {
// 清除定时器
if (timer1 != undefined) {
clearInterval(timer1);
}
// 清空要素图层
markerLayer.getSource().clear();
lineLayer.getSource().clear();
index = 0;
// 绘制轨迹线
if (points.length > 1) {
var lineFeature = new ol.Feature({
geometry: new ol.geom.LineString(points)
});
lineLayer.getSource().addFeature(lineFeature);
}
// 创建定时器
timer1 = setInterval(function () {
if (index
geometry: new ol.geom.Point(currentPoint)
});
markerLayer.getSource().addFeature(markerFeature);
//绘制文字数据
var inputText = currentPoint[0].toFixed(3).toString() + ", "+ currentPoint[1].toFixed(3).toString();
vectorSource.clear();
var newFeature = new ol.Feature({
geometry: new ol.geom.Point(currentPoint),
name: inputText === "" ? '标注点' : inputText
});
newFeature.setStyle(createLabelStyle(newFeature));
vectorSource.addFeature(newFeature);
index++;
} else {
clearInterval(timer1);
index = 0;
}
}, 100);
});

结语
如果您觉得该方法或代码有一点点用处,可以给作者点个赞,或打赏杯咖啡;╮( ̄▽ ̄)╭ 如果您感觉方法或代码不咋地//(ㄒoㄒ)//,就在评论处留言,作者继续改进;o_O??? 如果您需要相关功能的代码定制化开发,可以留言私信作者;(✿◡‿◡) 感谢各位大佬童鞋们的支持!( ´ ▽´ )ノ ( ´ ▽´)っ!!!
|